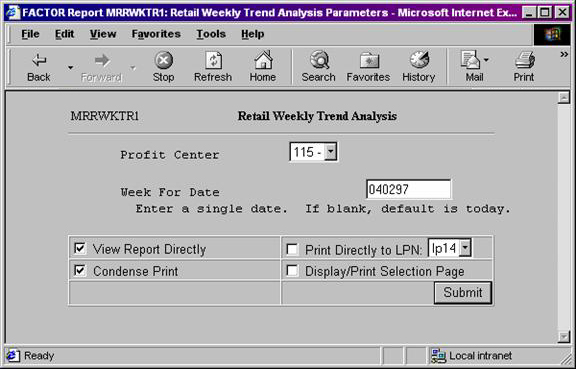
Retail Weekly Trend Analysis reports allow users to compare weekly sales and profit data for a selected week with sales and profit data for seven prior weeks. This information can be used to evaluate the profitability of specific products at specific profit centers.
Retail Weekly Trend Analysis reports require that you set System Parameter 1006 – Include Tax in Cost Layer. System Parameter 1006 lets you specify whether or not to include tax in cost layers. Set the parameter as follows:
Parameter Number: 1006
Description: Include Tax in Cost Layer
Value: N
Setting the value to "N" will ensure that there are no taxes in the fuel cost layers that need to be removed for calculation and presentation purposes. See the system parameter section for more information.
Reports are available for assigned profit centers.
Note: Retail Weekly Trend Analysis reports are generated offline. Normally these reports will be generated once monthly after all posting is complete for the month. See the offline reports topic for more information.
Click the report you want to view to highlight it. Then, click the select button.
The following information is listed on Retail Weekly Trend Analysis reports:
Week
Eight Period Average
Percent Change Between
Profit Center
Fuel Sales
Fuel Gallons
Fuel Margins
Category Sales
Category margins
Gross Profit
The report columns are as follows:
Week
The last Week column (column number 1) is the week entered on the report criteria screen. The other Week columns (2 through 8) represent prior weeks.
Note: Eight weeks are shown on the Retail Weekly Trend Analysis report. Prior weeks are chosen by subtracting one week from the selected Week ending date, and then subtracting one week from each subsequent Week ending Date.
Eight Period Average
The Eight Period Average column displays the eight week average for each category row. Values are rounded to the nearest whole number.
Percent Change Between 2 and 1
The Percent Change Between 2 and 1 column displays the percentage of change between columns (Weeks) number 1 and number 2. The following formula is used to calculate the percent of change:
((X – Y) / Y) * 100
X = the column (Week) number 1 value.
Y = the corresponding column (Week) number 2 value.
Values are rounded to two (2) places after the decimal.
The following sections are listed on the report:
Profit Center
Retail Weekly Trend Analysis reports print information for assigned profit centers.
Fuel Sales
The Fuel Sales section reports fuel sales for each of the eight weeks. Sub-categories are in alphabetical order and represent individual fuel categories.
Total Fuel Sales
The Total Fuel Sales row reports total fuel sales values. Totals are calculated by adding all Fuel Sales column values for the specified week.
Fuel Gallons
The Fuel Gallons section reports fuel gallon values for each of the eight weeks. Sub-categories are in alphabetical order and represent individual fuel categories.
Total Fuel Gallons
The Total Fuel Gallons row reports total fuel gallon values. Totals are calculated by adding all Fuel Gallons column values for the specified week.
Fuel Margins
The Fuel Margins section reports fuel margin values for each of the eight weeks. Sub-categories are in alphabetical order and represent individual fuel categories. Margins are calculated by:
X – Y
X = the retail value of the fuel product.
Y = the cost value of the fuel product.
Note: The system calculates fuel margin values. Cost values are not printed on Weekly Trend Analysis reports.
Category Sales
The Category Sales section reports inside sales values for each of the eight weeks. Sub-categories are in alphabetical order and represent individual sales categories.
Category Margins
The Category Margins section reports margin values for each category listed in the Category Sales section of the report. Margin values are calculated by the following formula:
X – Y
X = the retail value for the category.
Y = the cost value for the category.
Note: Margins are calculated by the system. Cost values are not printed on Retail Weekly Trend Analysis reports.
Gross Profit
The Gross Profit section reports gross profit values for the fuel and inside sales categories listed on the report. Gross Profit values are calculated by the following formula:
X – Y
X = the total sales value for the category.
Y = the corresponding total cost value for the category.
Note: Gross Profit values are calculated by the system. Cost values are not printed on Retail Weekly Trend Analysis reports.
Total Gross Profit
Total Gross Profit values are calculated by summing all Gross Profit column values for each of the eight weeks.
You may notice a slight rounding difference between totals on detail and summary reports. Click here to see why.