Rolling P & L History reports allow you to compare profit and loss information for a selected GL period with twelve prior months. Reports display merchandise sales, fuel sales, gross profit expenses, and net profit/losses.
Reports are available for assigned profit centers.
Note: Keep the following things in mind regarding this report:
This report is generated offline. Normally the report will be generated once monthly after all posting is complete for the month. See the offline reports topic for more information.
The gross percent calculated in this reports matches the gross percent of the sales reports only when you do not use account types PR (Product Revenue) or PE (Product Expense) for cost of goods sold or sales accounts in the alternate category set up. This discrepancy occurs because the merchandise sales data on the sales reports excludes sales and cost of goods sold for alternate categories.
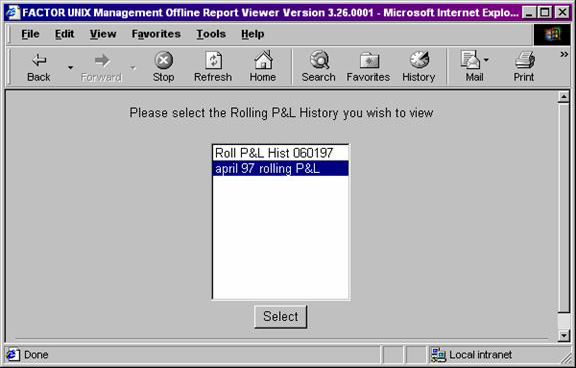
When you select Rolling P & L History reports, the system displays the following report criteria screen:
The following selection criteria allow you to specify the period you want to compare on the report and the way the report is viewed.
Enter the ending date for the period you want to compare. You must make an entry in this field and it must be in mm/dd/yy format. For example:
01/10/99
Note: You do not need to know the exact Period End Date. The system will find the actual End date for any date you enter.
You may specify how you want to view and/or print the report by choosing from the following selections:
· View Report Directly
· Condense Print
· Print Directly to LPN
· Display/Print Selection Page
Note: Rolling P & L History reports print in Landscape format.
The following information is listed on Rolling P & L History reports:

Note: Table MR_SALES is used to determine where values are displayed on Rolling P & L History reports. Table GF_VALUES is used to determine the actual GL values.
The report columns are as follows:
Period End Date
The Period End Date columns display profit and loss data pertaining to the specified date.
The following sections are listed on the report:
Profit Center
Rolling P & L History reports print information for assigned profit centers.
Fuel Sales
The Fuel Sales section reports total fuel sales for the specified period. Values are rounded to the nearest whole number.
Merchandise Sales
The Merchandise Sales section reports total merchandise sales for the period. Values are rounded to the nearest whole number.
Fuel Gross Profit Dollars
The Fuel Gross Profit Dollars section reports total gross profit dollars for fuel products only.
Fuel GP $ values are calculated by using the following formula:
(X – Y)
X = the sum of fuel sales for the specified period.
Y = the sum of fuel costs for the specified period. Note: Fuel cost values are retrieved by the system and do not print on Rolling History reports.
Values are rounded to the nearest whole dollar.
Merchandise Gross Profit Dollars
The Merch GP $ section displays gross profit dollars for inside sales. Merch GP $ values are calculated by using the following formula:
(X – Y)
X = the sum of merchandise sales for the specified period.
Y = the sum of merchandise costs for the specified period. Note: Merchandise cost values are retrieved by the system and do not print on Rolling P & L History reports.
Values are rounded to the nearest whole number.
Other Income
The Other Income section displays the total value of all sales accounts not included in fuel or merchandise categories for the corresponding period/year.
Total Expense
The Total Expense section displays the sum of expense account values for the corresponding period/year.
Net Income (Loss)
The Net Income (Loss) section displays the sum of Net Income values for the corresponding period/year.
Net Income (Loss) values are calculated by using the following formula:
(W + X + Y – Z)
W = the Fuel GP $ value for the specified period.
X = the corresponding Merch GP $ value.
Y = the corresponding Other Income value.
Z = the corresponding Total Expense value.
Values are rounded to the nearest whole number.
You may notice a slight rounding difference between totals on detail and summary reports. Click here to see why.