Financial Summary reports allow users to compare profit and loss information for a selected GL period with data from the same period from two prior years. Reports display merchandise sales, fuel sales, expenses, net profit/loss, and year-to-date data for each of the three years
Reports are available for assigned profit centers.
Note: Keep the following things in mind regarding this report:
Financial Summary reports are generated offline. Normally these reports will be generated once monthly after all posting is complete for the month. See the offline reports topic for more information.
The gross percent calculated in this report matches the gross percent of the sales reports only when you do not use account types PR (Product Revenue) or PE (Product Expense) for cost of goods sold or sales accounts in the alternate category set up. This discrepancy occurs because the merchandise sales data on the sales reports excludes sales and cost of goods sold for alternate categories.
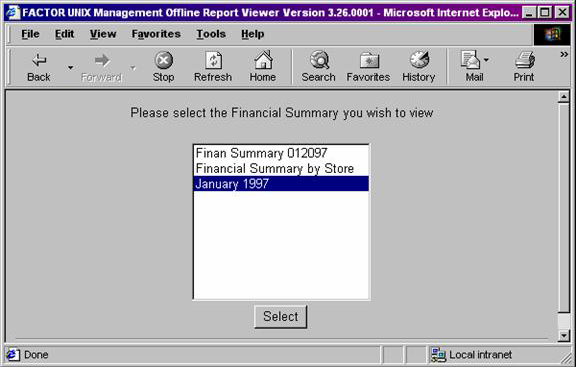
When you select Financial Summary reports, the system displays the following report criteria screen:
Click the report you want to view to highlight it. Then, click the Select button.
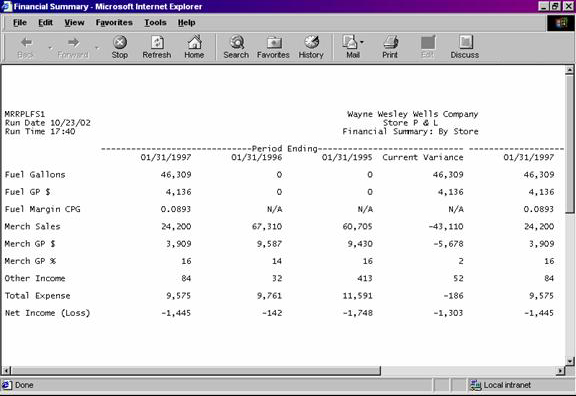
The following information is listed on Financial Summary reports:
Period Ending
YTD Ending
Period End Date
Current Variance
Profit Center
Fuel Gallons
Fuel GP $
Fuel Margin CPG
Merch Sales
Merch GP$
Merch GP%
Other Income
Total Expense
Net Income (loss)
The column headings are as follows:
Period Ending
The columns beneath the Period Ending heading display financial data pertaining to the specified period and year. The variance between the current and most recent prior year is also displayed.
Year-To-Date Ending
The columns beneath the Year-to-Date (YTD) Ending heading display year-to-date financial data for the current and two prior years. The variance between the current and most recent prior year is also displayed.
The report columns are as follows:
Period End Date
The Period End Date columns display financial data which pertain to the current or prior year specified by the date.
Current Variance
The Current Variance column displays the variance between the current year’s financial data and the most recent prior year’s data. Current Variance is calculated by using the following formula:
X – Y
X = the current period (or year) value.
Y = the corresponding most recent prior year’s period (or year) value.
The following sections are listed on the report:
Profit Center
Financial Summary reports print information for assigned profit centers.
Fuel Gallons
The Fuel Gallons section reports total fuel sales for the specified period and year. Values are rounded to the nearest whole number.
Fuel Gross Profit Dollars
The Fuel Gross Profit Dollars section reports total gross profit dollars for fuel products only.
Fuel GP $ values are calculated by using the following formula:
(X – Y)
X = the sum of fuel sales for the specified period/year (or the Year-to-Date sum for YTD Fuel GP $ values).
Y = the sum of fuel costs for the specified period/year (or Year-to-Date sum for YTD Fuel GP $ values). Note: Fuel cost values are retrieved by the system and do not print on Financial Summary reports.
Values are rounded to the nearest whole dollar.
Fuel Margin Cost Per Gallon
The Fuel Margin Cost Per Gallon (CPG) section reports fuel product margin cost per gallon values for the specified period and year. Fuel Margin CPG columns are calculated as follows:
X / Y
X = the Fuel GP $ value for the period/year.
Y = the corresponding Fuel Gallons value.
Values are rounded to four (4) places after the decimal.
Merchandise Sales
The Merch Sales section displays inside sales values for each selected period/year. Values are rounded to the nearest whole number.
Merchandise Gross Profit Dollars
The Merch GP $ section displays gross profit dollars for inside sales. Merch GP $ values are calculated by using the following formula:
(X – Y)
X = the sum of merchandise sales for the specified period/year (or the Year-to-Date sum for YTD Merch GP $ columns).
Y = the sum of merchandise costs for the specified period/year (or the Year-to-Date sum for YTD Merch GP $ columns). Note: Merchandise cost values are retrieved by the system and do not print on Financial Summary reports.
Values are rounded to the nearest whole number.
Merchandise Gross Profit Percentage
The Merchandise GP % section reports gross profit percentage values. Merch GP % values are calculated by using the following formula:
(X / Y) * 100
X = the Merch GP $ value for the period/year.
Y = the corresponding Merch Sales value.
Values are rounded to the nearest whole number.
Other Income
The Other Income section displays the total value of all sales accounts not included in fuel or merchandise categories for the corresponding period/year.
Total Expense
The Total Expense section displays the sum of expense account values for the corresponding period/year.
Net Income (Loss)
The Net Income (Loss) section displays the sum of Net Income values for the corresponding period/year.
Net Income (Loss) values are calculated by using the following formula:
(W + X + Y – Z)
W = the Fuel GP $ value for the period/year.
X = the corresponding Merch GP $ value.
Y = the corresponding Other Income value.
Z = the corresponding Total Expense value.
Values are rounded to the nearest whole number.
You may notice a slight rounding difference between totals on detail and summary reports. Click here to see why.