The Vendor Review Report provides you with a listing of sales performance and profitability of price book items for a specified time period. This report is an excellent tool to use when making stocking decisions for limited shelf space.
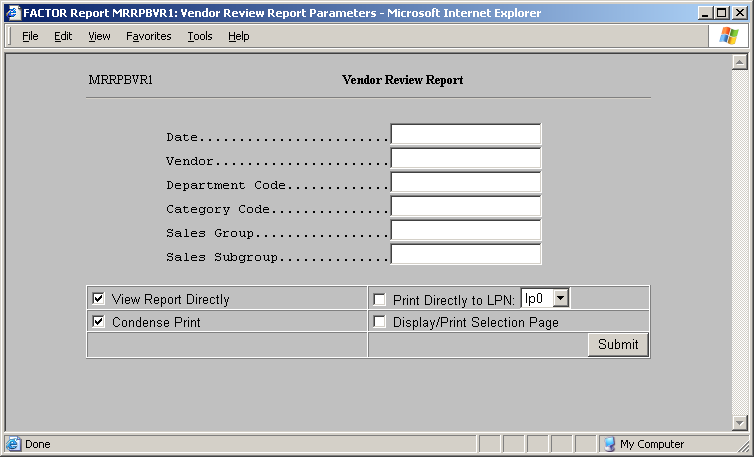
As with other DataTrak reports, this report provides drill down functionality based on the DataTrak profit center path configuration and the store assignment for the User ID used to access the report. This report is available in the Scanning Reports Document Group. When you select the report, DataTrak displays the following selection criteria screen:
The following selection criteria allow you to specify the information you want included on the report and the way the report is viewed.
Specify the Date or Date ranges for which you wish to review data. You can enter a single date or enter a date range by entering starting and ending dates separated by a colon.
Note: You must enter a date.
Specify the vendor for which wish to review sales data.
Enter the department code. You can report data for multiple department codes by entering a starting and ending code separated by a colon. Leave this field empty to include all departments in the selection process.
Enter the category code. You can report data for multiple categories codes by entering a starting and ending code separated by a colon. Leave this field empty to include all categories in the selection process.
Enter the sales group. You can report data for multiple sales groups by entering a starting and ending group separated by a colon. Leave this field empty to include all sales groups in the selection process.
Enter the sales subgroup. You can report data for multiple subgroups by entering a starting and ending subgroup separated by a colon. Leave this field empty to include all sales subgroups in the selection process.
You may specify how you want to view and/or print the report by choosing from the following selections:
View Report Directly
Condense Print
Print Directly to LPN
Display/Print Selection Page
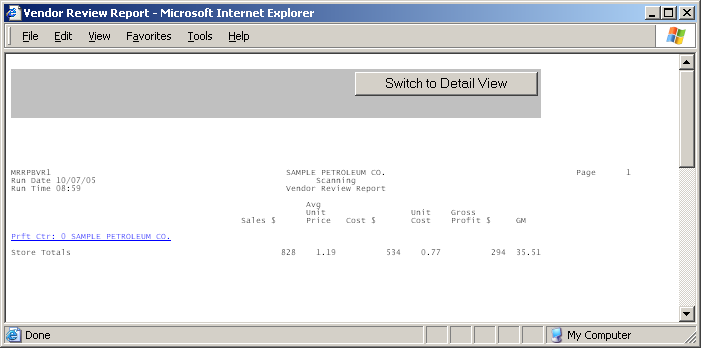
The summary report lists the following information
For summary reports the profit center number and name appears as a hyperlink. By clicking on a link, you can drill down further in the profit center path and view data in greater detail.
This column displays the sum of sales dollars for the profit center. Sales dollars are rounded to the nearest whole dollar.
This column displays the average sales price for the profit center. To calculate the Average Unit price the system divides the sum of sales dollars by the number of units sold.
This column displays the cost dollars for the profit center. Cost dollars are rounded to the nearest whole dollar.
This column displays the average unit cost
This column displays the gross profit dollars. To calculate the gross profit dollars, the system subtracts the cost dollars from the sales dollars.
Note: Because cost dollars are estimated based upon price book information, it is likely the gross profit will not match what is reported on the income statement.
This column displays the gross margin. The system uses the following formula to calculate the gross margin: [(Gross Profit $ / Sales $) * 100].
This report view lists data at the lowest level. The report Organizes data by
Profit Center Number
Department Code
Category Description
And Sales Dollars Percentage Rank.
Review the following detail report.
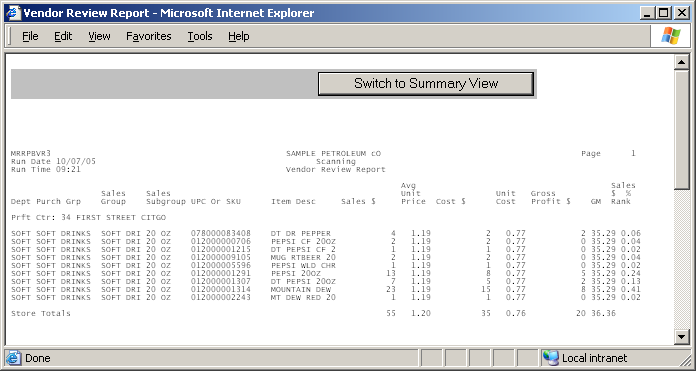
This column displays the department code for the item.
This column displays the purchase group for the item.
This column displays the sales group for the item.
This column displays the sales subgroup for the item.
This column displays the item's UPC or SKU number.
This column displays the item description
This column displays the sales dollars for the item and reporting period.
This column displays the average unit price for the item. To calculate the average unit price, the system divides the sales dollars by the number of units sold.
This column displays the estimated total cost dollars. To calculate the cost dollars, the system multiplies the unit cost by the number of units sold.
Note: The cost is based upon the price book. Therefore, it is likely the cost will not match the amount posted to the general ledger.
This column displays the per unit cost based on the packing units. The packing unit is entered in the format X/Y. "X" is a two digit number denoting the number of multi packs inside a case. "Y" is a two digit number denoting the number of items inside a multi pack. The price book cost represents the unit cost for the case. The system uses the following formula to calculate the per unit cost:
[price book cost / (X*Y)]
This column displays the gross profit dollars on sales. To calculate the gross profit, the system subtracts the cost dollars from the sales dollars.
Note: Because cost dollars are estimated based upon price book information, it is likely the gross profit will not match what is reported on the income statement.
This column displays the gross margin on the sale of items. The system uses the following formula to calculate the gross margin:
[(Gross Profit Dollars / Sales dollars) * 100]
This column displays the percent of sales the item contributes to the department to which it is associated. To calculate this amount, the system divides the sales dollars for the item by the total sales dollars for the department.