Store Comparative P & L reports show profit and loss information for a selected month. Additionally, the reports allow users to compare the profit and loss data of different stores in the reporting path. The report uses the Advanced Financial Line Control program so that users can format the report as desired.
Reports are available for assigned profit centers.
Note: You will need to set up this report as a line control report using the ExecuTrak Line Control Maintenance program on the Advanced Financial File Maintenance menu. For more information see ExecuTrak Operations Manual, Volume 12.
When you select Store Comparative P & L reports, the system displays the following report criteria screen:
Click the report you wish to view to highlight it, and then click the select button.
Information Presented On Store Comparative P & L Reports
Store Comparative P & L report rows need to be set up using the Advanced Financial Line Control Maintenance program. This program allows you to specify the information to print on each line of the report. See the ExecuTrak Operations Manual, Volume 12 for information on how to use the Line Control Maintenance program.
In order for the report Total % and Budget % calculations to be correct, the Sales/Total Income row set up by the user in the Line Control Maintenance program must be the first row in this report.
Note: Store Comparative P & L reports contain a large number of columns. Because of this, “green bar” (11x14x7/8) paper is recommended.
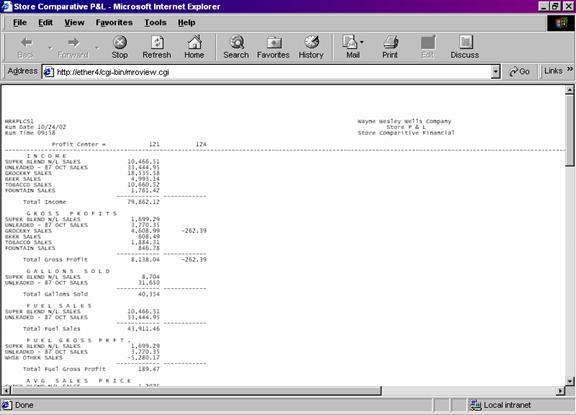
Store Comparative P & L reports display profit and loss values for the month entered as report criteria. Total, Total Budget, and Variance information is also included on the report.
You select the categories to print on the report by defining them through the Advanced Financial Line Control Maintenance program.
The report contains the following columns:
Store Number
The report displays the number of the profit center represented by the corresponding report data.
Total
The Total column is calculated by summing the corresponding column values for all profit centers.
Total Percent
Total % values are calculated by the following formula:
X / Y
X = the Total value for the selected row.
Y = the first Total value. For example, if the first Total value is 330,000. All subsequent Total values are divided by 330,000.
In order for the report Total % and Budget % calculations to be correct, the Sales/Total Income row set up by the user in the Line Control Maintenance program must be the first row in this report.
Budget
The Budget (Total) column is calculated by summing the corresponding column values for all profit centers.
Budget Percent
Budget % values are calculated by the following formula:
X / Y
X = the Budget Total value for the selected row.
Y = the first Total value. For example, if the first Budget Total value is 500,000. All subsequent Total values are divided by 500,000.
Variance
The Variance column displays the amount of variance between the actual and budgeted totals. Variance values are calculated by the following formula:
Y – X
X = the Total column value.
Y = the corresponding Budget Total column value.
You may notice a slight rounding difference between totals on detail and summary reports. Click here to see why.