Retail Period Profit Analysis reports allow users to compare profit information for a selected period with information for the same period from the previous year. Reports include period-to-date data, daily averages, projections, and comparisons.
Reports are available in summary and detail formats for assigned profit centers.
Note: Retail Period Profit Analysis reports are generated offline. This report should be generated each month after posting is complete. This offline report can be generated manually or the DataTrak Administrator can define the generation of this report as an "event" and let the scheduler create the report.
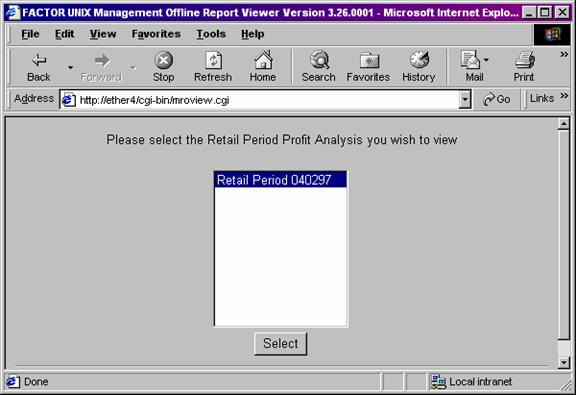
When you select Retail Period Profit Analysis reports, the system displays the offline report selection screen.
Click the report you want to view to highlight it, and then click the select button.
The following information is listed on Retail Period Profit Analysis Summary reports:
Profit Center
Sales Section
Gross Section (Optional)
Manual Section
Period-To-Date Heading
Daily Average Heading
Projected Thru EOP Heading
This Period Last Year
Retail Price
Units Sold
Total Amount
Percent
Average PPU
Average Units
Average Amount
The Retail Period Profit Analysis report prints information for assigned profit centers.
The column headings are as follows:
Period-To-Date
The columns beneath the Period-to-Date heading display information relating to the selected period through the date entered as report criteria.
Daily Average
The columns beneath the Daily Average heading display daily average information for the selected period.
Projected Thru End Of Period
The columns beneath the Projected Thru End of Period heading display projected values for the remaining selected period.
This Period Last Year
The columns beneath the This Period Last Year heading display data pertaining to the selected period one year earlier.
The following sections are listed on the report:
The Retail Period Profit Analysis report organizes data into three sections:
Sales
Gross (Optional. May or may not be omitted at generation.)
Manual
The Sales section of the report details sales data for item count inventory fuel products, item count inventory non-fuel products, and C-store inventory categories.
The Gross section of the report is optional and details gross profit for each of the products presented in the Sales section.
The Manual section of the report details miscellaneous general ledger entries recorded through Shift Report Entry.
The above sections are described in detail as follows:
The Sales section of the report details sales data for item count inventory fuel products, item count inventory non-fuel products, and C-store inventory categories. Retail sales data is analyzed and presented in regards to the following information:
Period-To-Date
Daily Average
Projected Thru EOP (end of period)
This Period Last Year
Period-To-Date – Retail Price
For fuel products, the amount in this column represents the current pump price. For non-fuel item count products, this amount represents the current selling price for the product. The report lists no period-to-date retail price for convenience products.
Period-To-Date – Units Sold
The Period-to-Date: Units Sold amount reports the total units sold for each fuel product and each non-fuel item count product from the beginning of the period through the current date.
Period-To-Date – Total Amount
The Period-to-Date: Total Amount reports the total sales dollars for all products from the beginning of the period through the current date.
Period-To-Date - %
The Period-to-Date: % value reports the percentage of sales for each product compared to the total sales for the product type (i.e. item count fuel, item count non-fuel, and convenience products).
Period-to-Date Percentage column values are calculated by the following formula:
X / Y
X = the Sales Period-to-Date Total Amount for the product.
Y = the total of Period-to-Date Sales for the product type.
For example, the system divides the total amount of sales for plus gas by the total amount of sales for all fuel products to calculate the Period-to-Date percentage for plus gas.
Period-To-Date – Avg. PPU
The Period-to-Date: Avg. PPU amount reflects the average price per gallon for the total sales from the beginning of the period through the current date.
For fuel products, Period-to-Date: Average PPU column values are calculated by the following formula:
X / Y
X = the Period-to-Date Total Amount.
Y = the corresponding Period-to-Date Units Sold value.
For convenience products, Period-To-Date Average PPU column values are calculated by the following formula:
X / Y
X = the Period-to-Date Amount value.
Y = the corresponding Period-to-Date Total Units Sold column value.
Daily Average - Avg. Units
The Daily Average: Avg. Units amount reports the average number of units sold daily. The report lists only daily average units for item count inventory products.
Since you do not record C-store sales in number of units, the report lists no Daily Average Units for C-store categories.
Daily Average: Avg. Units column values are calculated by the following formula:
X / Y
X = the Period-to-Date Units Sold.
Y = the elapsed number of days in the reporting period.
Note: The elapsed number of days equals the number of days since the beginning of the period through the current date.
Daily Average – Average Amount
The Daily Average: Average Amount value reports the average sales amount per day.
Daily Average: Avg. Amount values are calculated by the following formula:
X / Y
X = the Period–to-Date Total Amount value.
Y = the elapsed number of days in the reporting period.
Note: The elapsed number of days equals the number of days since the beginning of the period through the current date.
Projected Thru EOP – Total Units
The Projected Thru EOP: Total Units amount reflects the number of units you can anticipate to sell for the entire period.
For fuel products, Projected Total Units values are calculated by using the following formula:
X + Y
X = the estimated unit sales for the remainder of the period.
Y = the Period-To-Date: Units Sold value.
Note: The system uses data stored in the sales index table to estimate the unit sales for the remainder of the period.
For item count inventory non-fuel products, Projected Total Units values are calculated by using the following formula:
X * Y + Z
X = the Daily Average: Avg. Units value.
Y = the number of days remaining in the period.
Z = the corresponding Period-To-Date: Units Sold value.
Projected Thru EOP – Total Amount
The Projected Thru EOP: Total Amount value reflects the projected total sales through the end of the period.
For fuel products, Projected Total Amount values are calculated by using the following formula:
((W – X) * Y) + Z
W = the Projected Total Units value.
X = the corresponding Period-To-Date: Units Sold value.
Y = the current day’s retail price.
Z = the corresponding Period-To-Date: Amount value.
For C-store and non-fuel item count inventory products, Projected Total Amount values are calculated by using the following formula:
X * Y
X = the Daily Average: Amount value.
Y = the number of days in the period.
Projected Thru EOP – Average PPU
The Projected Thru EOP: Average PPU (Price Per Unit) values are calculated by using the following formula:
X / Y
X = the Projected Total Amount value.
Y = the corresponding Projected Total Units value.
For non-fuel products, the Projected Average PPU values are calculated as follows:
X / Y
X = the Projected Total Amount value.
Y = the Total Projected Total Units value.
Note: The above formula produces the same result as the Period-to-Date: Average Price Per Unit for convenience products.
This Period Last Year – Total Units
The This Period Last Year: Total Units value reports the total number of units sold during the same period for the previous year.
This Period Last Year – Total Amount
The This Period Last Year: Total Amount reports the total dollar amount sold during the same period for the previous year.
This Period Last Year – Avg. PPU
This Period Last Year: Average Price Per Unit values are calculated by using the following formula:
X / Y
X = the previous year’s Total Amount.
Y = the corresponding previous year’s Total Units.
For non-fuel products the This Period Last Year: Average PPU values are calculated by using the following formula:
X / Y
X = the previous year’s Total Amount value.
Y = the corresponding previous year’s Total Units value.
The Gross section of the report is optional and may not have been selected during generation. This section details gross profit for each of the products presented in the Sales section. Gross profit data is analyzed and presented in regards to the following information:
Period-To-Date
Daily Average
Projected Thru EOP (end of period)
This Period Last Year.
Period-To-Date - %
The Period-to-Date: % value represents the percentage of gross profit compared to gross sales.
Gross Period-To-Date Percentage values are calculated by using the following formula:
X / Y * 100
X = the Gross Period-To-Date Amount.
Y = the corresponding Sales Period-To-Date Total Amount.
Note: Gross % values are rounded to the first place after the decimal.
Period-To-Date – Amount
The Period-to-Date: Amount value reports the dollar gross profit amount. The system uses the FIFO average cost to calculate this amount for fuel products.
For convenience products, the Gross Period-To-Date: Amount values are calculated by using the following formula:
((V + W) / (X + Y)) * Z
V = the beginning cost dollars value.
W = the corresponding purchase cost dollars value.
X = the corresponding beginning retail dollars value.
Y = the corresponding retail value of purchases.
Z = the corresponding Sales Period-To-Date: Total Amount value.
(Beginning of month cost dollars + purchase cost dollars) / (beginning of month retail dollars + retail value of purchases) * Sales Period-To-Date Total Amount
For non-fuel item count inventory products, the Gross Period-To-Date: Amount values are calculated by using the following formula:
(W + X) – (Y – Z)
W = the beginning cost dollars value.
X = the corresponding purchase cost dollars value.
X = the corresponding ending inventory cost value.
Y = the corresponding Sales Period-To-Date: Total Amount.
(Beginning of month cost dollars + purchase cost dollars) – (ending inventory cost – Sales Period-To-Date Total Amount)
Period-To-Date – GPU
The Period-to-Date: GPU value reports a cents-per-gallon margin for fuel products. For non-fuel item count inventory, this amount represents a cents-per-unit margin.
For fuel products, Gross Period-To-Date: GPU values are calculated by using the following formula:
X / Y
X = the Gross Period-To-Date: Amount.
Y = the corresponding Sales Period-To-Date: Units Sold value.
For non-fuel item count inventory, Gross Period-To-Date: GPU values are calculated by using the following formula:
X / Y
X = the Gross Period-To-Date: Amount.
Y = the corresponding Sales Period-To-Date: Units Sold Total value.
Daily Average - %
The Daily Average: % value reports the percentage of gross profit compared to sales.
The Gross Daily Average: % column is calculated by using the following formula:
X / Y
X = Gross Daily Average: Amount value.
Y = the corresponding Daily Average: Amount from the Sales section.
Daily Average – Amount
The Daily Average: Amount value reports the average sales amount per day.
Daily Average: Amount values are calculated by the following formula:
X / Y
X = Period–To-Date: Amount value.
Y = the elapsed number of days in the reporting period.
Note: The elapsed number of days equals the number of days since the beginning of the period through the current date.
Projected Thru EOP - %
The Projected Thru EOP: % value reports the anticipated percentage of gross profit compared to sales.
The Projected Thru EOP: % column value is calculated by using the following formula:
X / Y * 100
X = the Gross Projected Amount.
Y = the corresponding Projected Total Amount from the Sales section.
Values are rounded to the first place after the decimal.
Projected Thru EOP – Amount
The Projected Thru EOP: Amount value reports the projected dollar gross profit amount through the end of the period.
For fuel products, Projected Amount values are calculated by using the following formula:
((W – X) * Y) + Z
W = the Projected Total Units value.
X = the corresponding Period-To-Date: Units Sold value.
Y = the current day’s fuel margin.
Z = the corresponding Period-To-Date: Amount value.
For convenience and non-fuel item count inventory products, Projected Amount values are calculated by using the following formula:
X * Y
X = the Daily Average: Amount value.
Y = the number of days in the period.
Projected Thru EOP – GPU
The Projected Thru EOP: GPU value reports the cents-per-gallon margin for fuel and a cents-per-unit margin for non-fuel item count inventory products.
For fuel products, the Projected GPU is calculated by using the following formula:
X / Y
X = the Gross Projected Amount.
Y = the corresponding Sales Projected Total Units value.
For convenience products, the Projected GPU is calculated by using the following formula:
X / Y
X = the Gross Projected Amount.
Y = the corresponding Sales Total Projected Total Units value.
This Period Last Year - %
The This Period Last Year: % value reports the percentage of gross profit compared to sales.
The This Period Last Year: % column is calculated by using the following formula:
X / Y * 100
X = the previous year’s Gross Period-To-Date: Amount value.
Y = the corresponding previous year’s Sales Period-To-Date: Amount value.
This Period Last Year – Amount
The This Period Last Year: Amount value reports the dollar gross profit for the same period in the previous year.
This Period Last Year – GPU
For fuel products, the This Period Last Year: GPU value reports a cents-per-gallon margin. For non-fuel item count inventory products this amount reports a cents-per-unit margin.
For fuel products, the This Period Last Year: GPU column is calculated by using the following formula:
X / Y
X = the This Period Last Year: Gross Amount value.
Y = the corresponding This Period Last Year: Sales Total Units value.
For convenience and non-fuel item count inventory, Gross This Period Last Year: GPU values are calculated by using the following formula:
X / Y
X = the Gross This Period Last Year: Amount value.
Y = the Sales This Period Last Year: Total Units Total value.
The Manual section of the report details miscellaneous general ledger entries recorded through Shift Report Entry. The data is analyzed and presented in regards to the following information:
Period-To-Date
Daily Average
Projected Thru EOP (end of period)
This Period Last Year
Period-To-Date – Amount
The Period-to-Date: Amount reports the total dollars for the general ledger account through the current date.
Period-To-Date - %
The Manual Period-To-Date: % column is calculated by using the following formula:
X / Y
X = the Manual Period-To-Date: Amount value for the item.
Y = the Manual Period-To-Date: Amount Total value.
Daily Average – Amount
The Manual Daily Average: Amount column is calculated by using the following formula:
X / Y
X = the Manual Period-to-Date: Amount value.
Y = the number of elapsed days in the reporting period.
Projected Thru EOP – Amount
The Projected Thru EOP: Amount column is calculated by using the following formula:
X * Y
X = the Daily Average: Amount value.
Y = the number of days in the period.
Projected Thru EOP – %
The Projected Thru EOP: % value reports the total projected percentage for the item compared to all items.
The Manual Projected Thru EOP: % column is calculated by using the following formula:
X / Y * 100
X = the Projected Thru EOP: Amount value.
Y = the Projected Thru EOP: Amount Total value.
This Period Last Year – Amount
The This Period Last Year: Amount value reports the total amount for the general ledger account for the same period in the previous year.
This Period Last Year - %
The This Period Last Year: % value reports the amount of the item compared to the total amount for all items during the same period in the previous year.
The Manual This Period Last Year: % column is calculated by using the following formula:
X / Y
X = the This Period Last Year: Amount value.
Y = the This Period Last Year: Amount Total value.
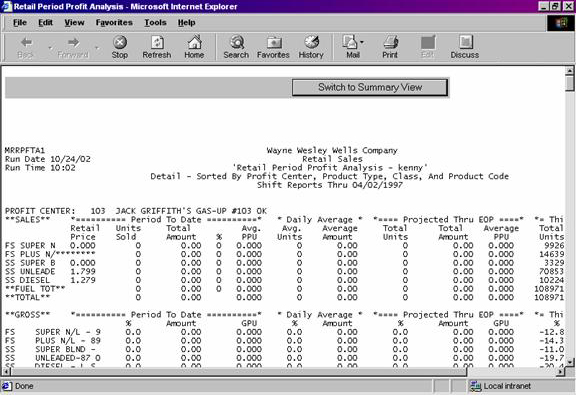
The Retail Period Profit Analysis Detail report gives you more detailed information for the data reported on the Summary report.
Many of the values on the Detail report are rounded. Because of this rounding, figures may differ from the Summary report, which should be considered more accurate.
The following information is listed on Retail Period Profit Analysis Detail reports:
Profit Center
Sales Section
Gross Section (Optional)
Manual Section
Period-To-Date heading
Projected Thru EOP Heading
This Period Last Year
Retail Price
Units Sold
Total Amount
Percent
Average PPU
Average Units
Average Amount
The Retail Period Profit Analysis report prints information for assigned profit centers.
The column headings are as follows:
Period To Date
The columns beneath the Period-to-Date heading display information relating to the selected period through the date entered as report criteria.
Daily Average
The columns beneath the Daily Average heading display daily average information for the selected period through the date entered as report criteria.
Projected Thru End Of Period
The columns beneath the Projected Thru End of Period heading display projected values for the selected period through the date entered as report criteria.
This Period Last Year
The columns beneath the This Period Last Year heading display data pertaining to the selected period one year earlier.
The following sections are listed on the report:
Like the Summary report, the Retail Period Profit Analysis Detail report organizes data into three sections:
Sales
Gross (Optional. May or may not have been selected at generation.)
Manual
The Sales section details sales data for item count inventory fuel products, item count inventory non-fuel products, and C-store inventory categories.
The Gross section of the report is optional and details gross profit for each of the products presented in the Sales section.
The Manual section of the report details miscellaneous general ledger entries recorded through Shift Report Entry.
The Sales section details the Sales section displayed on the Summary report. Underneath this heading, a listing for each individual product category pertaining to sales is displayed. As with the Summary report, retail sales data is analyzed and presented in regards to the following information:
Period-To-Date
Daily Average
Projected Thru EOP (End of Period)
This Period Last Year
The columns beneath the above headings are calculated in the same manner as on the Summary report.
The Gross section of the report is optional. This section details gross profit for each of the product categories presented in the Sales section. Gross profit data is analyzed and presented in regards to the following information:
Period-To-Date
Daily Average
Projected Thru EOP (End of Period)
This Period Last Year
The columns beneath the above headings are calculated in the same manner as on the Summary report.
The Manual section details the Manual section displayed on the Summary report. Underneath this heading, a detailed listing of miscellaneous general ledger entries is displayed. As with the Summary report, data is analyzed and presented in regards to the following information:
Period-To-Date
Daily Average
Projected Thru EOP (End of Period)
This Period Last Year
The columns beneath the above headings are calculated in the same manner as on the Summary report.
You may notice a slight rounding difference between totals on detail and summary reports. Click here to see why.