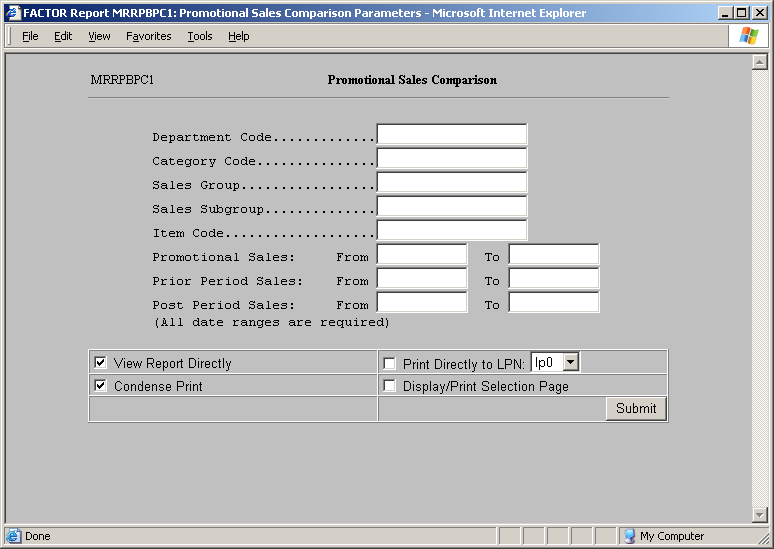
The Promotional Sales Comparison report details the effectiveness of a particular item promotion. By viewing period sales promotion data side by side with previous sales data for the same products, you can easily compare the sales to evaluate the effectiveness of the promotion. As with other DataTrak reports, this report provides drill down functionality based on the DataTrak profit center path configuration and the store assignment for the User ID used to generate the report. This report is available in the Scanning Reports Document Group. When you select the report, DataTrak displays the following selection criteria screen:
The following selection criteria allow you to specify the information you want included on the report and the way the report is viewed.
Specify the department code for which you wish to compare promotional sales data. Enter the department code or leave this field empty to include all department codes in the selection process.
Specify the category code for which you wish to compare promotional sales data. Enter the category code or leave this field empty to include all category codes in the selection process.
Specify the sales subgroup for which you wish to compare promotional sales data. Enter the sales group or leave this field empty to include all sales groups in the selection process.
Specify the sales subgroup for which you wish to compare promotional sales data. Enter the sales subgroup or leave this field empty to include all sales subgroups.
Specify the item code for which you wish to compare promotional sales data. Enter the item code or leave this field empty to include all items in the selection process.
Enter the beginning and ending dates to identify the promotional sales period. The promotional sales dates are a required criteria.
Enter the beginning and ending dates for the period prior to the dates of the sales promotion. The prior period dates are required criteria.
Enter the beginning and ending dates for the period after the dates of the sales promotion. The post period dates are required criteria.
You may specify how you want to view and/or print the report by choosing from the following selections:
View Report Directly
Condense Print
Print Directly to LPN
Display/Print Selection Page
The Promotional Sales Comparison Summary report presents three columns.
The first group of columns compares the prior period sales to the promotional period sales. The top number in each row identifies the value for the prior period, and the bottom number identifies the value for the promotional period.
The second group of columns compares the promotional period sales to the post period sales. The top number in each row identifies the value for the promotional period, and the bottom number in each row identifies the value for the post period.
The third group of column calculates the difference between the promotional period values and the prior and post period values. The top number in each row displays the difference between the promotional period and the prior period; the bottom number in each row displays the difference between the promotional period and the post period.
This column displays the total sales dollars for the identified period.
This column displays the total profit dollars for the identified period. To calculate the profit, the system subtracts the cost dollars from the sales dollars.
This column displays the number of units sold.
The Promotional Sales Comparison Detail report groups sales data by profit center. The report lists 4 columns for each of the three date range criteria. The columns include:
The Promotional Sales Comparison Summary report presents three groups of columns with 4 columns in each group.
The first group of columns compares the prior period sales to the promotional period sales. The top number in each row identifies the value for the prior period, and the bottom number identifies the value for the promotional period.
The second group of columns compares the promotional period sales to the post period sales. The top number in each row identifies the value for the promotional period, and the bottom number in each row identifies the value for the post period.
The third group of column calculates the difference between the promotional period values and the prior and post period values. The top number in each row displays the difference between the promotional period and the prior period; the bottom number in each row displays the difference between the promotional period and the post period.
The columns on the report include:
This column displays the unit price for the identified period.
This column displays the total sales dollars for the identified period.
This column displays the profit dollars for the identified period. To calculate the profit dollars, the system subtracts the cost dollars from the sales dollars.
This column displays the number of units sold for the identified period.