Budget Period Comparison reports allow users to compare current sales data for a particular date range with budgeted sales data for the same date range. Current year-to-date activity for the period may also be compared with budget year-to-date data.
Reports are available in summary and detailed format for both parent and child profit centers.
When you select Budget Period Comparison reports, the system displays the following Selection Criteria screen:
The following selection criteria allow you to specify the information you want included on the report and the way the report is viewed.
Enter the starting date for the period you wish to compare with the budget data. You must make an entry in this field and it must be in mm/dd/yy format. For example:
01/10/99
Enter the ending date for the period to be compared with the budget data. You must make an entry in this field and the date must be greater than the Beginning Date. Use the mm/dd/yy format. For example:
09/10/99
Note: If the Ending Date is not greater than the Beginning Date, or if the Beginning and Ending dates are not within the same GL period, the system will display an error message.
You may specify how you want to view and/or print the report by choosing from the following selections:
· View Report Directly
· Condense Print
· Print Directly to LPN
· Display/Print Selection Page
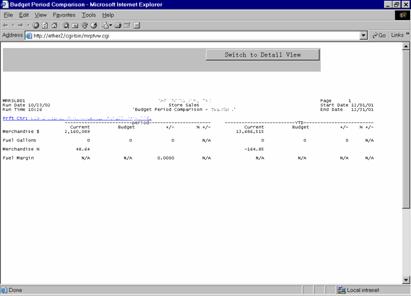
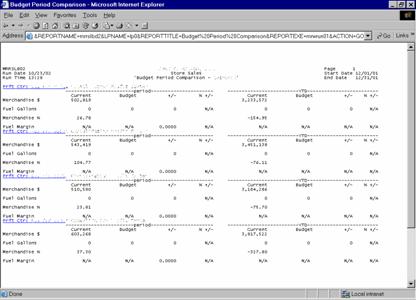
The following information is listed on Budget Period Comparison Summary reports:
Profit Center
Period
YTD
Current
Budget
+/-
% +/-
Merchandise $
Fuel Gallons
Merchandise %
Fuel Margin
Note: Table MR_SALES is used to retrieve sales data and table GL_MASTER is used to retrieve budget data.
The report displays the name and number of the profit center represented by the corresponding report data.
If a profit center has a child profit center, it appears as a hyperlink. Clicking on the hyperlink allows you to view summary report information for each child profit center.
The column headings for the report are as follows:
Period
The columns beneath the Period heading refer to sales data pertaining to the specified period (whether a current period or a budget period).
Year-To-Date
The columns beneath the Year-To-Date (YTD) heading refer to sales data pertaining to the year (whether current year-to-date information or budget year-to-date information). For YTD data, the values represent sales (actual or budget) from the beginning of the year through the period specified as selection criteria.
The report columns are as follows:
Current
The Current column displays the current year’s value for the corresponding category during the specified period. The YTD Current column displays the current year-to-date value. Unless otherwise noted, these values are calculated by summing all current year category values for the period/year.
Budget
The Budget column displays the year’s budgeted value for the corresponding category during the specified period. The YTD Budget column displays the current budget year-to-date value. Unless otherwise noted, these values are calculated by summing all current year category budget values for the period/year.
The following formula is used to determine the values for the Period Budget column:
(X / Y * Z)
X = the budgeted amount retrieved from the GL_MASTER table.
Y = the number of days in the period.
Z = the number of days that fall on or between the selected Beginning and Ending Date.
For example: The budget amount for period 8 is 600.00. There are 31 days in period 8 and 20 days between the Beginning and Ending date selected.
600/31 * 20 = 387.0968
Values are rounded to the nearest whole dollar, so the current budget amount is $387.00.
The YTD Budget column values are figured by adding the sum of budget amounts for the year’s periods prior to the chosen period and then adding the total value to the current period value.
The +/- column displays the difference between the current and prior year values. Unless otherwise noted, the following formula is used to calculate Period and YTD: +/- column values:
(X – Y)
X = the Period (or YTD) Current column.
Y = the Period (or YTD) Budget column.
Values in the Period and YTD: +/- columns are rounded to the nearest whole number (dollars or gallons), unless otherwise noted. If there are no Y values available for the calculations, the report prints N/A.
%+/-
The +/- column displays the percent of difference between the current and prior year values. Unless otherwise noted, the following formula is used to calculate Period and YTD: %+/- column values:
((X –Y) / Y) * 100
X = the Period (or YTD) Current column value.
Y = the corresponding Period (or YTD) Budget column value.
Values in the Period and YTD: %+/- columns are rounded to two (2) places after the decimal. If there are no Y values available for the calculations, the report prints N/A.
The report sections are as follows:
Merchandise $
The Merchandise $ section reports merchandise sales values. Current and budget values are used to calculate the figures for each of the corresponding columns in the category. Column values are rounded to the nearest whole dollar except in the Period and YTD: % +/- columns where values are rounded to two (2) places after the decimal.
Fuel Gallons
The Fuel Gallons section reports fuel gallon values. Current and budget gallon values are used to calculate the figures for each of the corresponding columns in the category. Column values are rounded to the nearest whole gallon except in the Period and YTD: % +/- columns where values are rounded to two (2) places after the decimal.
Merchandise %
The Merchandise % section reports merchandise sales margin values.
Merchandise % - Period and YTD: Current Column
The following formula is used to calculate the Merchandise % - Period and YTD: Current column values:
(X / Y) * 100
X = the Period (or YTD) current year merchandise gross profit (GP) value for each category listing. Note: Gross profit values are retrieved and calculated by the system. They are not displayed on Budget Period Comparison reports.
Y = the corresponding value from the Merchandise $ - Period (or YTD) Current column.
For example:
(Period: Current GP / Period: Current Merchandise $) * 100
(YTD Current GP / YTD: Current Merchandise $) * 100
Merchandise % - Period and YTD: Budget Column
The following formula is used to calculate the Merchandise % - Period and YTD: Budget column values:
((Y – X) / X) * 100
X = the calculated Period (or YTD) total Budget amount for merchandise sales.
Y = the Period (or YTD) Budget column value from the Merchandise $ section.
Values are rounded to two (2) places after the decimal. If there are no Y values available for the calculations, the report prints N/A.
Fuel Margin
The Fuel Margin section reports fuel margin values.
The following formula is used to calculate the Fuel Margin – Period and the YTD: Current column values:
(X / Y)
X = the Period (or YTD) fuel gross profit value for each category listing. Note: Gross profit values are retrieved and calculated by the system. They are not displayed on Budget Period Comparison reports.
Y = the corresponding value from the Fuel Gallons - Period (or YTD): Current column.
The following formula is used to calculate the Fuel Margin Period and YTD: Budget column values:
((Y – X ) / Z)
X = the Period (or YTD) Total Fuel Budget value calculated by the system.
Y = the corresponding budgeted cost value calculated by the system.
Z = the Fuel Gallons - Period or YTD: Budget column value.
Values are rounded to four (4) places after the decimal except in the Period and YTD: %+/- columns where values are rounded to two (2) places after the decimal.
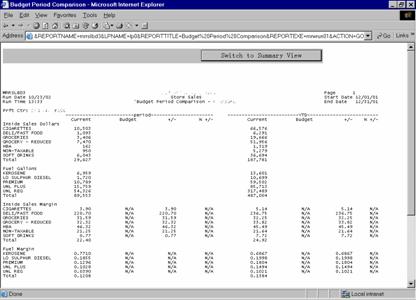
The Budget Period Comparison Detail report displays more detailed information for each section listed on the Budget Period Comparison Summary report.
Values on the detail report are rounded to the nearest whole number (dollar or gallon), or they are rounded to a specified place after the decimal. Because each value is rounded, Total values may differ from the Summary report. The Summary report should be considered more accurate.
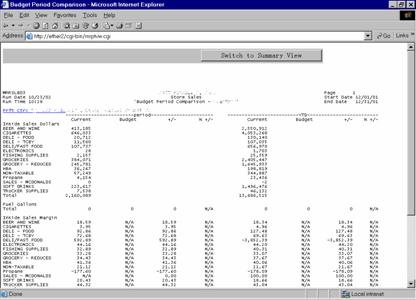
The following information is listed on Budget Period Comparison Detail reports:
The report displays the name and number of the profit center represented by the corresponding report data.
If a profit center has a child profit center, it appears as a hyperlink. Clicking on the hyperlink allows you to view summary information for each child profit center.
The column headings for the report are as follows:
Period
The columns beneath the Period heading refer to sales data pertaining to the specified period.
Year-To-Date
The columns beneath the Year-To-Date (YTD) heading refer to sales data pertaining to the indicated year. For YTD data, the values represent sales from the beginning of the year through the period specified as selection criteria.
Unless otherwise noted, the formulas used to calculate the Current, Prior, +/-, and % +/- columns for each section of the detail report are exactly the same as the formulas used to calculate the same sections on the summary report.
The report sections are as follows:
Inside Sales Dollars
The Inside Sales Dollars section details the Merchandise $ section displayed on the Summary report. Underneath this heading, a listing for each individual category pertaining to Inside Sales Dollars is displayed.
Values for each column pertaining to the Inside Sales Dollar section are calculated using the same formulas as the Summary report. Total values are calculated as follows:
Period and YTD: Current Total values = the sum of all Current column listings for the section.
Period and YTD: Budget Total values = the sum of all Budget column listings for the section.
Period and YTD: +/- Total values are figured by using the (X - Y) equation.
X = the Period or YTD: Total Current column value.
Y = the corresponding Period or YTD: Total Budget column value.
Period and YTD: % +/- Total values are figured by using the ((X - Y) / Y) * 100 equation.
X = the Period or YTD: Total Current column value.
Y = the corresponding Period or YTD: Total Budget column value.
Values are rounded to the nearest whole dollar except in the Period and YTD: % +/- columns where values are rounded to two (2) places after the decimal.
Fuel Gallons
The Fuel Gallons section details the Fuel Gallons section displayed on the Summary report. Underneath this heading, a listing of each individual category pertaining to Fuel Gallons is displayed.
Values for each column pertaining to the Fuel Gallons section are calculated using the same formulas as the Summary report. Total values are calculated as follows:
Period and YTD: Current Total values = the sum of all Current column listings for the section.
Period and YTD: Budget Total values = the sum of all Budget column listings for the section.
Period and YTD: +/- Total values are figured by using the (X - Y) equation.
X = the Period or YTD: Total Current column value.
Y = the corresponding Period or YTD: Total Budget column value.
Period and YTD: % +/- Total values are figured by using the ((X - Y) / Y) * 100 equation.
X = the Period or YTD: Total Current column value.
Y = the corresponding Period or YTD: Total Budget column value.
Values are rounded to the nearest whole gallon except in the Period and YTD: % +/- columns where values are rounded to two (2) places after the decimal.
Inside Sales Margin
The Inside Sales Margin section details the Merchandise % section displayed on the Summary report. Underneath this heading, a listing for each individual category pertaining to Inside Sales Margin is displayed.
The following formula is used to calculate the Inside Sales Margin - Period and YTD: Current and Total Current column values:
(X / Y ) * 100
X = the gross profit values for each Period (or YTD): Current category listing (or the sum of all gross profit values for the category listings for Total values). Note: Gross profit values are retrieved and calculated by the system. They are not displayed on Budget Period Comparison reports.
Y = the corresponding Period (or YTD): Current or Total Current column value from the Inside Sales Dollars section of the report.
The following formula is used to calculate the Inside Sales Margin - Period and YTD: Budget and Budget Total column values:
((Y- X) / Y) * 100
X = the calculated Period (or YTD) total Budget amount for merchandise sales (or sum of all calculated budget values for Total columns).
Y = the Period (or YTD) Budget (or Total Budget) column value from the Inside Sales section.
Period and YTD: Total +/- and %+/- column values are calculated using the following formulas:
Period and YTD: +/- Total values are figured by using the (X - Y) equation.
X = the Period or YTD: Total Current column value.
Y = the corresponding Period or YTD: Total Budget column value.
Period and YTD: % +/- Total values are figured by using the ((X - Y) / Y) * 100 equation.
X = the Period or YTD: Total Current column value.
Y = the corresponding Period or YTD: Total Budget column value.
Fuel Margin
The Fuel Margin section details the Fuel Margin section from the Summary report. Underneath this heading, a listing for each individual category pertaining to Fuel Margin is displayed.
The following formula is used to calculate the Fuel Margin - Period and YTD: Current and Total Current column values:
(X /Y )
X = the gross profit values for each Period (or YTD): Current category listing (or the sum of all gross profit values for the Current listings for Total values). Note: Gross profit values are retrieved and calculated by the system. They are not displayed on Budget Period Comparison reports.
Y = the corresponding Current or Total Current column value from the Fuel Gallons section of the report.
The following formula is used to calculate the Fuel Margin -Period and YTD: Budget and Total Budget values:
((Y – X ) / Z)
X = the sum of all Period (or YTD) Budget values calculated by the system.
Y = the corresponding Budget cost amount values.
Z = the Fuel Gallons - Period or YTD: Budget (or Budget Total) column value.
Period and YTD: Total +/- and %+/- column values are calculated using the following formulas:
Period and YTD: +/- Total values are figured by using the (X - Y) equation.
X = the Period or YTD: Total Current column value.
Y = the corresponding Period or YTD: Total Budget column value.
Period and YTD: % +/- Total values are figured by using the ((X - Y) / Y) * 100 equation.
X = the Period or YTD: Total Current column value.
Y = the corresponding Period or YTD: Total Budget column value.
If a profit center has child profit centers, you may click on the parent profit center’s hyperlink to view summary report information for its child profit centers.
Child Budget Period Comparison Summary reports are based on the same selection criteria you entered for the parent profit center.
Summary information for child profit centers is calculated in the same manner as it is for parent profit centers. See the Budget Period Comparison Summary report section for more information.
Click on the child profit center’s hyperlink to view a Budget Period Comparison Child Detail report.
Detail information for child profit centers is calculated in the same manner as it is for parent profit centers. See the Budget Period Comparison Detail report section for more information.
You may notice a slight rounding difference between totals on detail and summary reports. Click here to see why.