13 Week Comparison reports allow users to compare a store’s payroll hours for a selected week with payroll data from twelve prior weeks. The report displays actual hours, overtime hours, and average hours. This information can be used to find unusual hourly activity.
Note: If you use the Time N Attendance method for recording payroll, Factor cannot guarantee that the Regular and Overtime hours listed on the 13 Week Comparison report are accurate.
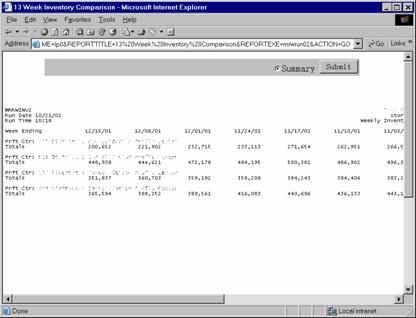
Reports are available in summary and detailed formats for both parent and child profit centers.
When you select 13 Week Comparison reports, the system displays the report selection criteria screen. The following selection criteria allow you to specify the information you want included on the report and the way the report is viewed.
Enter the ending date for the week you wish to compare. You must make an entry in this field and it must be in mm/dd/yy format. For example:
01/10/99
You may specify how you want to view and/or print the report by choosing from the following selections:
· View Report Directly
· Condense Print
· Print Directly to LPN
· Display/Print Selection Page
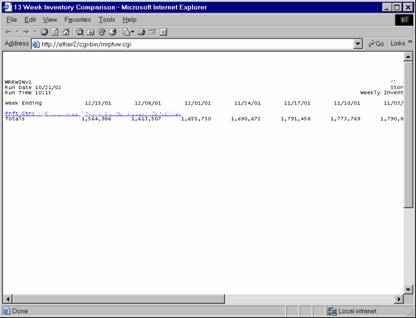
The following information is listed on 13 Week Comparison Summary reports:
Week Ending Date
Profit Center
Regular
Overtime
Total
Budget
Variance
Note: Tables TIME_N_ATTEND and WFMS_DIST_HOURS are used to retrieve payroll data. TMI_PAYROLL is used to retrieve budget hours.
The report columns are as follows:
Week Ending Date
The Week Ending Date columns contain payroll data pertaining to the specified date. The first Week Ending Date is the date entered through the Selection Criteria screen. Each subsequent Ending Date represents a prior week.
Note: Thirteen weeks are shown on the 13 Week Comparison report. Prior weeks are chosen by subtracting one week from the selected Week Ending date, and then subtracting one week from each subsequent Week Ending Date.
The following sections are listed on the report:
Profit Center
The report displays the name and number of the profit center represented by the corresponding report data.
If a profit center has a child profit center, it appears as a hyperlink. Clicking on the hyperlink allows you to view summary information for child profit center(s).
Regular
Regular values report regular payroll hours for each corresponding Week Ending Date column.
Overtime
Overtime values report overtime payroll hours for each corresponding Week Ending Date column.
Total
Total values report total payroll hours for each corresponding Week Ending Date column.
Total values are calculated by using the following formula:
(X +Y)
X = the Regular hours value.
Y = the corresponding Overtime hours value (from the same column).
Budget
Budget values report the calculated budget payroll hours for each corresponding Week Ending Date column.
Variance
Variance values are the difference between the Total payroll hours and the Budget payroll hours for the corresponding Week Ending Date.
Variance values are calculated by using the following formula:
(X – Y)
X = the Budget value.
Y = the corresponding Total value (from the same column).
Average
Average values are the average payroll hours for each corresponding Week Ending Date column.
Average values are calculated by using the following formula:
(X / 13)
X = the sum of all payroll hour values.
The 13 Week Comparison Detail report gives you more detailed information for the data reported on the 13 Week Comparison Summary report.
The following information is listed on 13 Week Comparison Detail reports:
Week Ending Date
Average
Profit Center
Paycodes
Totals
Note: Tables TIME_N_ATTEND and WFMS_DIST_HOURS are used to retrieve payroll data. TMI_PAYROLL is used to retrieve budget hours and TMI_PAY_CODE is used to retrieve pay codes.
The report columns are as follows:
Week Ending Date
The Week Ending Date columns contain payroll data pertaining to the specified date. The first Week Ending Date is the date entered through the Selection Criteria screen. Each subsequent Ending Date represents a prior week.
Note: Thirteen weeks are shown on the 13 Week Comparison report. Prior weeks are chosen by subtracting one week from the selected Week Ending date, and then subtracting one week from each subsequent Week Ending Date.
Average
Average values are the weekly average payroll hours for each corresponding pay code.
Average values are calculated by using the following formula:
(X / 13)
X = the sum of all payroll hour values for each pay code.
The following sections are listed on the report:
Profit Center
The report displays the name and number of the profit center represented by the corresponding report data.
If a profit center has a child profit center, it appears as a hyperlink. Clicking on the hyperlink allows you to view summary information for child profit center(s).
Pay Code
13 Week Comparison reports display one row for each of the individual pay codes associated with the specified profit center. Pay code values are the sum of regular and overtime hours associated with the specified pay code for the corresponding Week Ending Date.
Total
Total values are the total payroll hours associated with each pay code for the corresponding Week Ending Date column. Total values are calculated by summing all pay code column values for the date.
If a profit center has child profit centers, you may click on the parent profit center’s hyperlink on the 13 Week Comparison Summary report to view summary report information for its child profit centers.
The 13 Week Comparison Child Summary report is based on the same selection criteria you entered for the parent profit center.
Payroll values for the same thirteen weeks are calculated and depicted in the same manner as they are for parent profit centers. See the 13 Week Comparison Summary report section for more information.
Click on the child profit center’s hyperlink to view a 13 Week Comparison Child Detail report.
Detail information for child profit centers is calculated in the same manner as it is for parent profit centers. See the 13 Week Comparison Detail report section for more information.
You may notice a slight rounding difference between totals on detail and summary reports. Click here to see why.